

DOMESTIC ON TIME PERFORMANCE
May 2022
Jetstar
0
% Arrivals on time
0
% Departure on time
0
% Cancellations
Qantas
0
% Arrivals on time
0
% Departure on time
0
% Cancellations
Virgin Australia
0
% Arrivals on time
0
% Departure on time
0
% Cancellations
REX
0
% Arrivals on time
0
% Departure on time
0
% Cancellations
All Airlines
0
% Arrivals on time
0
% Departure on time
0
% Cancellations
MAIN DOMESTIC ROUTES
Top 10 domestic city pairs, April 2022
| City pair | Passengers YE Apr 21 (000) | Passengers YE Apr 22 (000) | % change |
|---|---|---|---|
| Melbourne-Sydney | 1,351.8 | 2,897.0 | 114.3 |
| Brisbane-Sydney | 893.5 | 1,438.0 | 60.9 |
| Brisbane-Melbourne | 613.4 | 1,158.1 | 88.8 |
| Gold Coast-Sydney | 482.2 | 1,052.8 | 118.3 |
| Gold Coast-Melbourne | 499.8 | 1,041.2 | 108.3 |
| Brisbane-Cairns | 765.0 | 1,020.5 | 33.4 |
| Adelaide-Melbourne | 423.6 | 830.6 | 96.1 |
| Brisbane-Townsville | 520.5 | 692.0 | 32.9 |
| Adelaide-Sydney | 450.7 | 643.0 | 42.7 |
| Brisbane-Mackay | 394.2 | 548.9 | 39.2 |
| ALL CITY PAIRS | 16,367.0 | 27,160.0 | 65.9 |
DOMESTIC AIR MARKET
April 2022
| Apr 21 | Apr 22 | Growth % | Year end Apr 21 | Year end Apr 22 | Growth % | |
|---|---|---|---|---|---|---|
| Total pax carried | 3.53m | 4.66m | 31.9 | 16.37m | 27.16m | 65.9 |
| Revenue pax km (RPK) | 4.02bn | 5.49bn | 36.6 | 18.47bn | 31.06bn | 68.2 |
| Available seat kms (ASK) | 5.68bn | 6.99bn | 23.0 | 29.36bn | 48.92bn | 66.7 |
| Load factor (%) | 70.7 | 78.4 | +7.7* | 62.9 | 63.5 | +0.6* |
| Aircraft trips (000) | 42.9 | 50.0 | 16.8 | 264.7 | 398.2 | 50.4 |
INTERNATIONAL AIR MARKET SHARE
International passengers by major airline – year ended April 2022
INTERNATIONAL AIR ROUTES
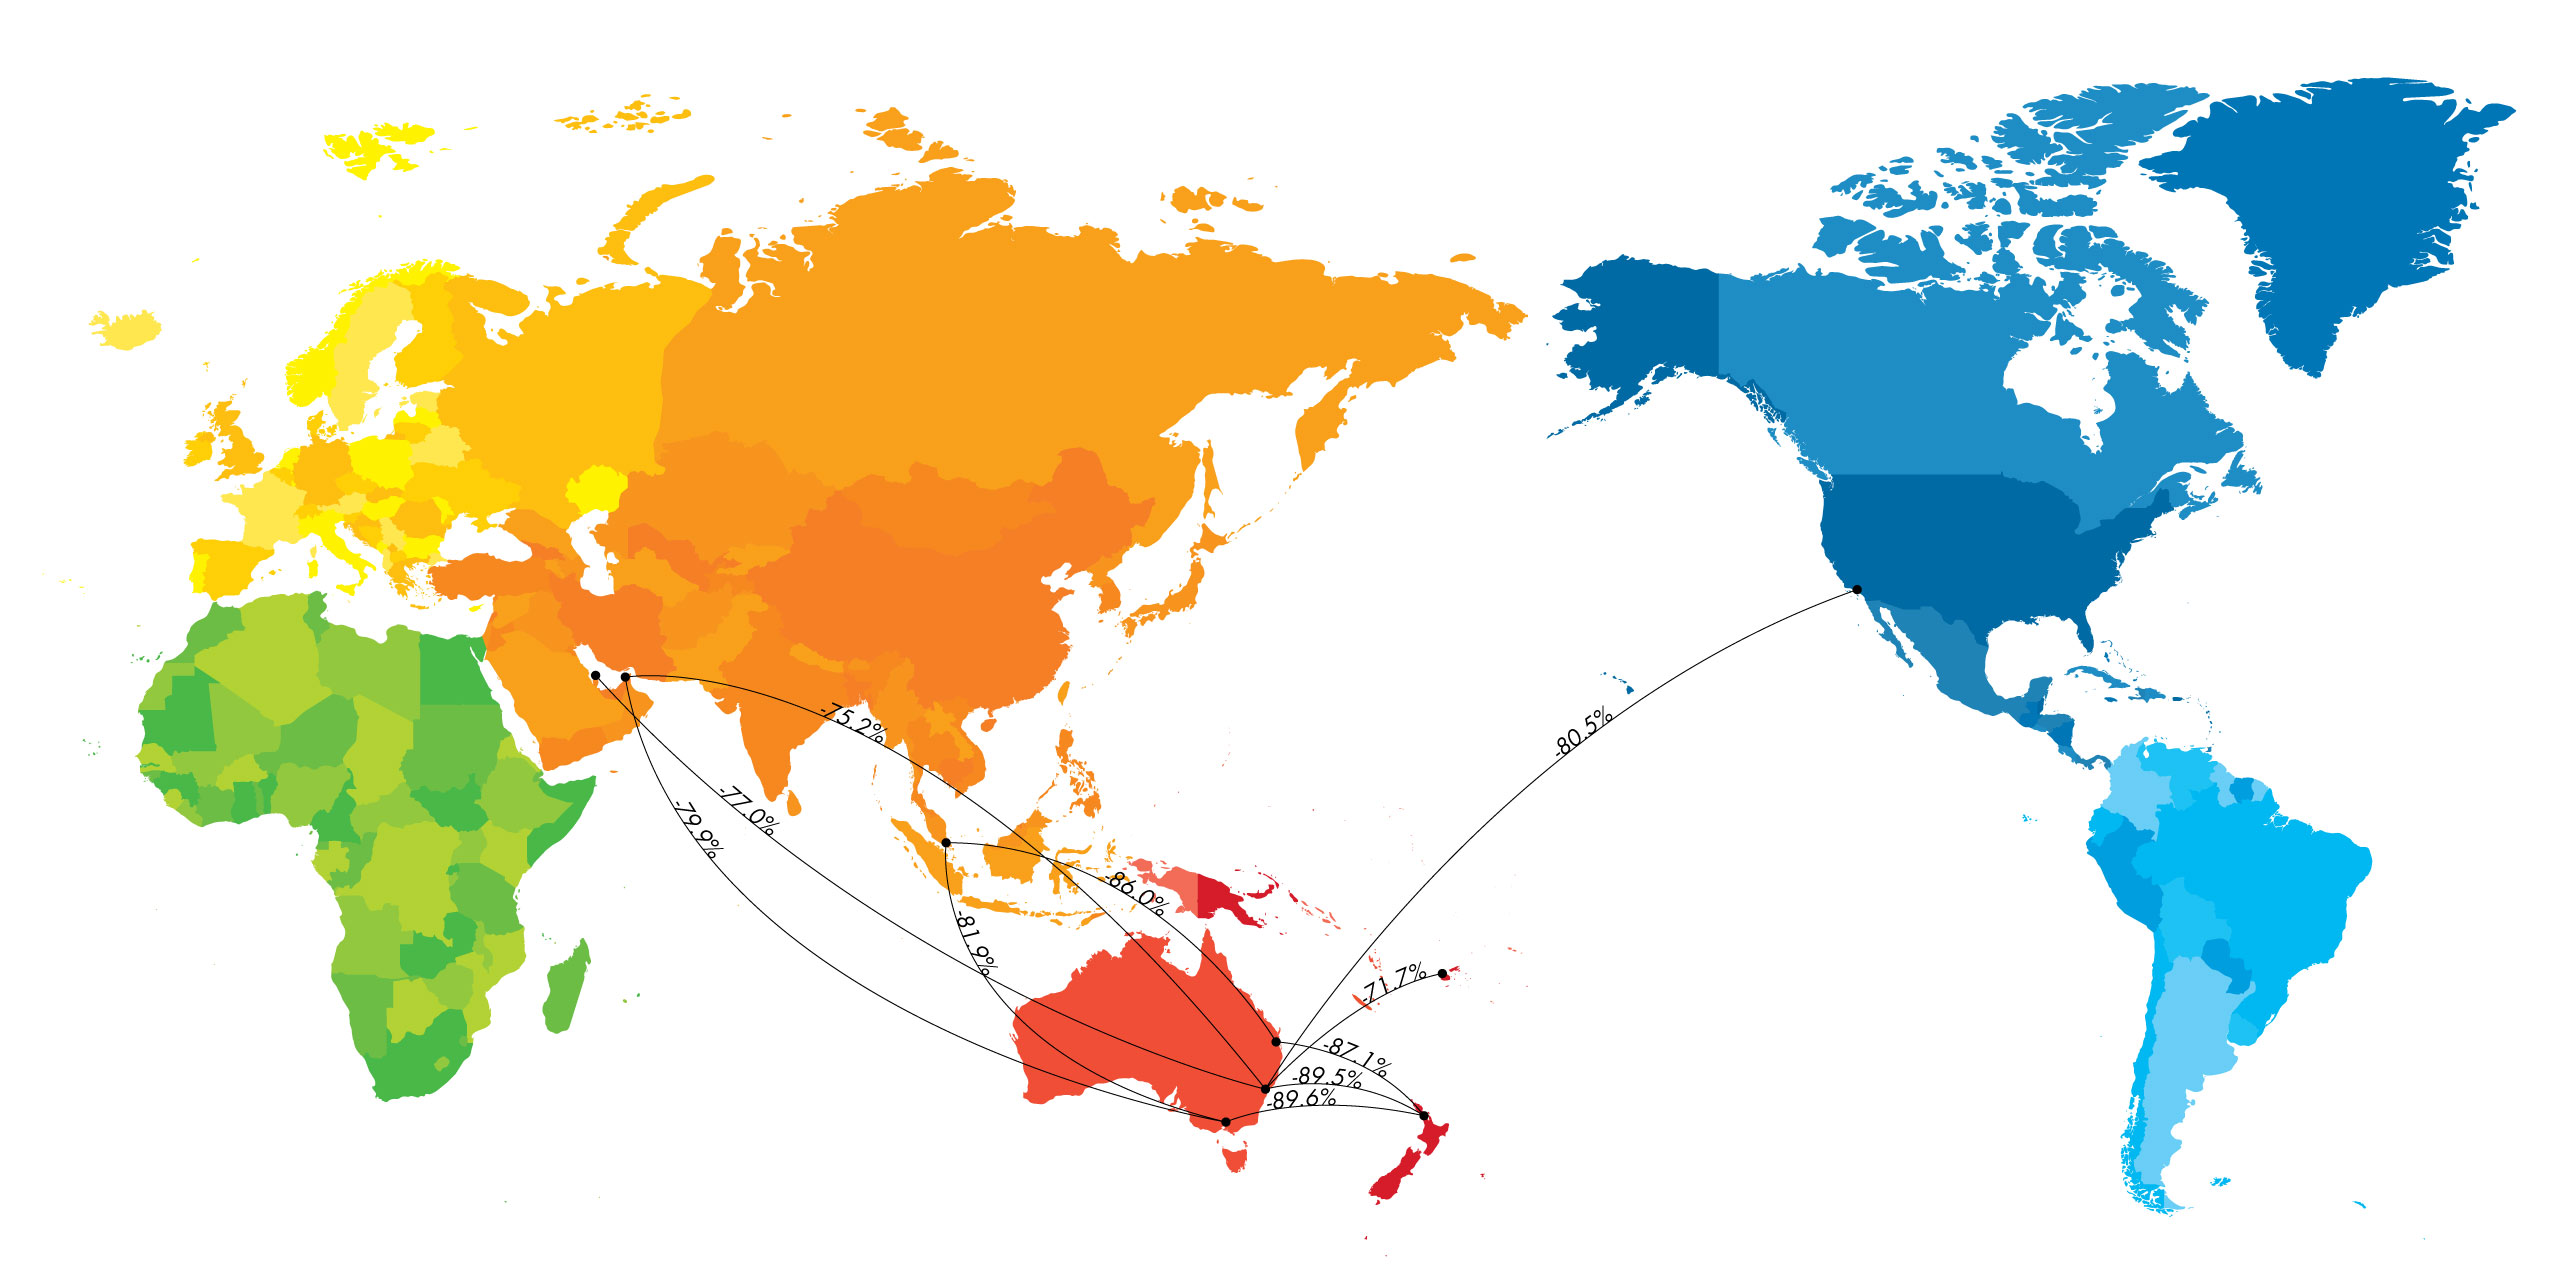
Top 10 city pairs, April 2022
| City pair | Passengers YE Apr 19 | Passengers YE Apr 20 | Passengers YE Apr 21 | Passengers YE Apr 22 | % change 19/22 |
| Singapore-Melbourne | 1,602,064 | 1,415,457 | 15,809 | 290,498 | -81.9% |
| Dubai-Sydney | 821,367 | 692,562 | 26,608 | 203,775 | -75.2% |
| Los Angeles-Sydney | 883,959 | 804,373 | 25,824 | 172,325 | -80.5% |
| Auckland-Sydney | 1,579,451 | 1,382,503 | 65,734 | 166,106 | -89.5% |
| Nadi-Sydney | 490,260 | 475,787 | 2,319 | 138,870 | -71.7% |
| Dubai-Melbourne | 659,770 | 594,444 | 17,541 | 132,696 | -79.9% |
| Auckland-Melbourne | 1,250,516 | 1,083,960 | 39,240 | 129,522 | -89.6% |
| Singapore-Brisbane | 880,194 | 856,560 | 15,700 | 123,204 | -86.0% |
| Auckland-Brisbane | 941,378 | 834,211 | 39,732 | 121,482 | -87.1% |
| Doha-Sydney | 479,704 | 494,278 | 55,060 | 110,136 | -77.0% |
| Top 10 City Pairs | 9,588,663 | 8,634,135 | 303,567 | 1,588,614 | -83.4% |
| Other City Pairs | 32,299,366 | 28,516,686 | 528,636 | 2,420,811 | -92.5% |
| ALL CITY PAIRS | 41,888,029 | 37,150,821 | 832,203 | 4,009,425 | -90.4% |
ARRIVALS
Top 10 destinations, April 2022
| Country of residence | Apr 2019 | Apr 2021 | Apr 2022 | Change - Mar 22/Apr 22 |
|---|---|---|---|---|
| New Zealand | 119,220 | 16,320 | 42,500 | 23,700 |
| UK | 59,150 | 660 | 31,890 | 3,940 |
| India | 30,920 | 280 | 26,570 | 9,290 |
| Singapore | 29,850 | 230 | 21,410 | 7,820 |
| USA | 60,830 | 880 | 17,540 | 3,060 |
| Canada | 15,180 | 130 | 5,670 | 600 |
| Indonesia | 13,470 | 150 | 5,600 | 2,780 |
| Germany | 13,450 | 120 | 4,740 | 50 |
| Thailand | 13,280 | 70 | 4,190 | 1,840 |
| Malaysia | 24,690 | 90 | 4,110 | 1,070 |
| All visitors arrivals | 700,370 | 22,610 | 235,460 | +65,210 |
RETURNS
Top 10 destinations, April 2022
| Country of stay | Apr 2019 | Apr 2021 | Apr 2022 | Change - Mar 22/Apr 22 |
|---|---|---|---|---|
| New Zealand | 129,210 | 10,250 | 34,380 | 24,970 |
| USA | 81,130 | 600 | 32,320 | 13,450 |
| India | 30,270 | 670 | 32,010 | 12,600 |
| Fiji | 29,130 | 10 | 26,760 | 15,560 |
| UK | 35,670 | 330 | 21,750 | 10,380 |
| Singapore | 38,900 | 250 | 16,490 | 9,640 |
| Thailand | 53,500 | 110 | 13,920 | 7,470 |
| Indonesia | 108,010 | 170 | 11,240 | 9,560 |
| Philippines | 20,380 | 50 | 7,530 | 4,700 |
| Vietnam | 32,480 | 60 | 5,700 | 3,380 |
| All resident returns | 916,430 | 16,990 | 282,630 | +136,290 |